Tuesday, December 27, 2011

Saturday, October 24, 2009
What Is The Geographic Approach?

Perhaps you've heard ESRI president Jack Dangermond mention The Geographic Approach. It's a phrase he often uses to describe his high-level vision for using geospatial technology as a key method in finding answers to problems.
The Geographic Approach provides the necessary framework for GIS analysis.
"Geography, the science of our world, coupled with GIS is helping us [better] understand the earth and apply geographic knowledge to a host of human activities," Dangermond says. "The outcome is the emergence of The Geographic Approach—a new way of thinking and problem solving that integrates geographic information into how we understand and manage our planet. This approach allows us to create geographic knowledge by measuring the earth, organizing this data, and analyzing and modeling various processes and their relationships. The Geographic Approach also allows us to apply this knowledge to the way we design, plan, and change our world."
Solving problems using a geographic approach is not new. It is fundamental to the way geographers study and analyze our world. The concept is perhaps best articulated by Ian L. McHarg in the 1969 book Design with Nature, in which he details the philosophical context for managing human activities within natural and cultural landscapes.
As a methodology, The Geographic Approach is used for location-based analysis and decision making. GIS professionals typically employ it to examine selected geographic datasets in detail, which are combined for the comprehensive study and analysis of spatial problems. This methodology parallels the well-known scientific method and includes a research-focused, iterative process for examining diverse datasets and uncovering potential solutions. GIS augments the analytic process, helping give people a clearer understanding of complex problems that often include geographic components. This in turn allows better decision making and more opportunities to conserve limited resources, as well as improves the way we work. Many experienced GIS professionals intuitively begin their projects with a structured methodology of this nature. But for those new to GIS technology, these five steps will provide a defined and proven approach.
Step 1: Ask
Approaching a problem geographically involves framing the question from a location-based perspective. What is the problem you are trying to solve or analyze, and where is it located? Being as specific as possible about the question you're trying to answer will help you with the later stages of The Geographic Approach, when you're faced with deciding how to structure the analysis, which analytic methods to use, and how to present the results to the target audience.
Step 2: Acquire
After clearly defining the problem, it is necessary to determine the data needed to complete your analysis and ascertain where that data can be found or generated. The type of data and the geographic scope of your project will help direct your methods of collecting data and conducting the analysis. If the method of analysis requires detailed and/or high-level information, it may be necessary to create or calculate the new data. Creating new data may simply mean calculating new values in the data table or obtaining new map layers or attributes but may also require geoprocessing. Sometimes you might have to consider using surrogate measures, which allows data creation through indirect means. For example, an economic indicator can be used as a surrogate for income. However, because of the limits in collecting accurate data in this way, it is necessary to indicate in your results the manner in which the data was collected.
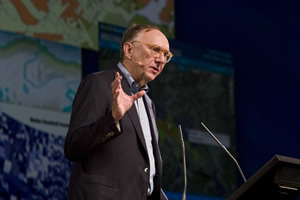
ESRI President Jack Dangermond says that the Geographic Approach is a new way of thinking and problem solving.
Step 3: Examine
You will not know for certain whether the data you have acquired is appropriate for your study until you thoroughly examine it. This includes visual inspection, as well as investigating how the data is organized (its schema), how well the data corresponds to other datasets and the rules of the physical world (its topology), and the story of where the data came from (its metadata). Since the data ultimately selected for your analysis depends on your original question or questions, as well as the results that you are seeking and how those results will be used, your examination may be dependent on how precise the data must be to answer the original questions. Because data acquisition can be the most expensive and time-consuming part of the process, it is important that you begin with a well-defined data model for your organization and your project. This will provide the basis for evaluating potential data acquisitions.
Step 4: Analyze
The data is processed and analyzed based on the method of examination or analysis you choose, which is dependent on the results you hope to achieve. Understanding the effects of parameters you have established for the analysis, as well as the algorithms being implemented, is critical so that you can correctly interpret the results. Do not underestimate the power of "eyeballing" the data. Looking at the results can help you decide whether the information is valid or useful, or whether you should rerun the analysis using different parameters or even a different method. GIS modeling tools make it relatively easy to make these changes and create new output.
Step 5: Act
The results and presentation of the analysis are important parts of The Geographic Approach. The results can be shared through reports, maps, tables, and charts and delivered in printed form or digitally over a network or on the Web. You need to decide on the best means for presenting your analysis. You can compare the results from different analyses and see which method presents the information most accurately. And you can tailor the results for different audiences. For example, one audience might require a conventional report that summarizes the analyses and conveys recommendations or comparable alternatives. Another audience may need an interactive format that allows them to ask what-if questions or pursue additional analysis. Yet another audience may simply need to know how the results affect them or their interests.
The Geographic Approach provides the necessary framework for GIS analysis and helps ensure accurate, verifiable results. By carefully documenting, archiving, and sharing your results and methodology, other researchers receive the opportunity to verify your findings. This practice, called full disclosure, also allows statistical measures of the reliability of this data to be established.
Clearer Understanding of Results
Using a methodology such as The Geographic Approach formalizes the analytic process with GIS, which allows a clearer understanding of the results and promotes a response that can be supported by the data. By applying The Geographic Approach to help us solve complex problems, we can make better decisions, conserve resources, and improve the way we work.
Google to monitor deforestation

USA: Google is joining forces with space agencies around the world and the conservation organization Group on Earth Observations (GEO) to monitor deforestation rates using satellite imagery. Among the space agencies working on the program are NASA, the ESA, and the national space agencies of Japan, Germany, Italy, India, and Brazil.
The GEO is a global partnership of 80 governments and more than 50 organizations. Internet company Google currently collects satellite images for use in its Google Earth application, and will be providing satellite images to the project.
Annual monitoring via satellite images will help identify changes in areas of forest more accurately than ever before. The data will be important in helping support programs in which governments, environmental groups, and investors pay to protect certain forests.
The seven countries would act as pilot programs including Australia, Brazil, Cameroon, Guyana, Indonesia, Mexico, and Tanzania. All of these locations have had satellite images taken in the last few months. The U.S. has satellite images from Landsat going all the way back to 1972 to use for comparisons.
Source : http://planetsave.com/
Friday, October 23, 2009
ArcGIS Server
OverviewArcGIS Server connects people with the geographic information they need. Organizations use ArcGIS Server to distribute maps and GIS capabilities via Web mapping applications and services to improve internal workflows, communicate vital issues, and engage stakeholders.
With ArcGIS Server, you can
Publish fast, intuitive Web maps tailored to your audience, dramatically strengthening business and resource decisions with real-time geointelligence.
Geographically enable your IT investments, shrinking data and application redundancy, optimizing system configurations, and consolidating enterprise systems.
Centrally manage your geodata, providing better data security and integrity for your most important information assets.
Simplify access to large volumes of imagery resources, significantly reducing storage costs and data processing overhead.
Extend GIS to your mobile workforce, increasing the accuracy and value of field data collection projects and asset monitoring as well as resource and event management.
With ArcGIS Server, you can
Publish fast, intuitive Web maps tailored to your audience, dramatically strengthening business and resource decisions with real-time geointelligence.
Geographically enable your IT investments, shrinking data and application redundancy, optimizing system configurations, and consolidating enterprise systems.
Centrally manage your geodata, providing better data security and integrity for your most important information assets.
Simplify access to large volumes of imagery resources, significantly reducing storage costs and data processing overhead.
Extend GIS to your mobile workforce, increasing the accuracy and value of field data collection projects and asset monitoring as well as resource and event management.
Monday, March 19, 2007

Thursday, February 22, 2007
Mobile GIS Applications

Mobile GIS is the expansion of a geographic information system (GIS) from the office into the field. A mobile GIS enables field based personnel to capture, store, update, manipulate, analyze, and display geographic information. Mobile GIS integrates one or more of the following technologies: Mobile devices, Global Positioning Systems (GPS) and Wireless communications for Internet GIS access.

Traditionally, the processes of field data collection and editing have been time consuming and error prone. Geographic data has traveled into the field in the form of paper maps. Field edits were performed using sketches and notes on paper maps and forms. Once back in the office, these field edits were deciphered and manually entered into the GIS database. The result has been that GIS data has often not been as up-to-date or accurate as it could have been.
Taking GIS into the field opens up new opportunities for more up-to-date and accurate GIS data. The developments in mobile GIS have enabled GIS to be taken into the field as digital maps on compact, mobile computers, providing field access to enterprise geographic information. This enables organizations to add real-time information to their database and applications, speeding up analysis, display, and decision making by using up-to-date, more accurate spatial data.
Firefighters, police officers, engineering crews, surveyors, utility workers, soldiers, census workers, field biologists, and more use mobile GIS to complete the following tasks :
Field Mapping—Create, edit, and utilize GIS maps while in the field
Asset Inventories—Create and maintain an inventory of asset locations and attribute information
Asset Maintenance—Update asset location, condition, and schedule maintenance
Inspections—Maintain digital records and locations of field assets for legal code compliance and ticketing
Incident Reporting—Document the location and circumstances of incidents and events for further action or reporting
GIS Analysis and Decision Making—Perform measuring, buffering, geoprocessing, and other GIS analysis while in the field.
Images shown are Mobile GIS application areas and ArcPad customization for environmental applications.

Monday, February 19, 2007
What is GIS?
A geographic information system (GIS), or more commonly referred to as a geospatial information system or Geographic Information Science, is a system for capturing, storing, analyzing and managing data and associated attributes which are spatially referenced to the earth. In the strictest sense, it is a computer system capable of integrating, storing, editing, analyzing, sharing, and displaying geographically-referenced information. In a more generic sense, GIS is a tool that allows users to create interactive queries (user created searches), analyze the spatial information, edit data, and present the results of all these operations. Geographic information science is the science underlying the applications and systems, taught as a degree program by several universities.
Geographic information system technology can be used for scientific investigations, resource management, asset management, Environmental Impact Assessment, Urban planning, cartography, criminology, history, sales, marketing, and route planning. For example, a GIS might allow emergency planners to easily calculate emergency response times in the event of a natural disaster, a GIS might be used to find wetlands that need protection from pollution, or a GIS can be used by a company to find new potential customers similar to the ones they already have and project sales due to expanding into that market.

Geographic information system technology can be used for scientific investigations, resource management, asset management, Environmental Impact Assessment, Urban planning, cartography, criminology, history, sales, marketing, and route planning. For example, a GIS might allow emergency planners to easily calculate emergency response times in the event of a natural disaster, a GIS might be used to find wetlands that need protection from pollution, or a GIS can be used by a company to find new potential customers similar to the ones they already have and project sales due to expanding into that market.

Friday, December 08, 2006
Business Opportunities with Google Earth

Can you imagine, may be next ten years...Google Earth user can observe the earth using real time high resolution satellite imagery!...I think it can be real...probably Google Earth need to cooperate with Digital Globe or Space Imaging to provide real time imageries...and it will be the best application in the geographic world... Lots of people have been speculating on what Google's business model is by giving away a free version of Google Earth.
Others are offering services to sell to businesses to provide Google Earth reference data to help customers find their products and services. A real estate broker is offering information on homes through a large database through the Google Earth interface.
Another company, called GlobeAssistant.com, is offering services to help businesses in the travel industry, real estate, and news services to use Google Earth to enhance their businesses. For example, they are selling a service to take recent news stories and present the location of the story through an RSS feed in Google Earth format.
News organizations can use Google Earth to quickly show its readers or viewers geographic references related to their stories. This has already been done numerous times. And I expect it will become more common as these organizations learn more about Google Earth. I expect Google will have special pricing and special versions of the tool for these customers as well.
Travel is a very interesting area which would allow businesses (say travel agents) to provide special presentations on tours, hotel locations, restaurants, etc. for prospective travellers with Google Earth as the presentation vehicle. They could also use it as a research tool to quickly find information customers are interested in finding. Sports is another area with enormous potential. We can used Google Earth to learn more about the Le Tour De Langkawi routes, Paris-Dakar Rally routes and the location of the riders in just a few minutes than we had ever learned in the past. Using it to watch long-distance sailboat races is another thing we can expect to see any day.
Google Earth has a very open interface for allowing outside data resources to be incorporated both statically and dynamically within it. There are many applications people haven't even thought of which will result in business opportunities. I forsee applications for computer games, flight simulation, custom weather data, sports, travel, oil exploration, TV shows, and much more.
The other thing about Google Earth is that it is free and supported by a very high-profile company like Google. The type of market awareness they will generate when they release Google Earth more publicly will guarantee a high number of people who use the application. This will translate into market opportunities for many kinds of businesses. Based on our experience with this phenomena starting with Mosaic and Netscape, I'm confident great things are in store for Google Earth and innovators who ride the wave. The image shown above is Petronas Twin Tower in 3D, develop in Sketch-Up and publish it using Google Earth format, .KML
Thursday, January 05, 2006
Muar, the ancient, the city and the future for all mankind...
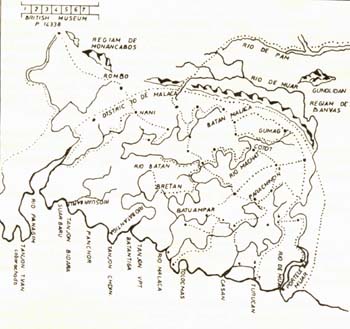 The map of Ortelius A.D. 1584 shows Muar as a town at the south of Melaka. The history of Muar started since the times of the Hindu empire. According to history, the name Muar appeared much earlier than the Melaka empire existed. In 1361, there was a Bhuddist monk (a religious adviser in Majapahit Palace) named Prapanca wrote the famous poetry, Nagarakertagama. This poetry recorded the history of the empire of Majapahit in the Malay peninsular. The king was Hayam Wuruk and his prime minister was Gajah Mada (1350 - 1389). Muar was one of the state under this empire.
There are other souces of history that proof the early existence of Muar before Melaka. Barros wrote in 1553 about Parameswara (Paramicura), founder of the Melaka empire, was exiled from Temasik (Singapore) after he killed the king. He stopped at Muar and built a wooden fort at a place called Pagoh. In Sejarah Melayu, Temasik which then was ruled by Sultan Iskandar Syah, was defeated by the Majapahit empire. Sultan Iskandar Syah moved to Muar. Here he opened two areas near the river Muar called Biawak Busuk and built a fort named Kota Buruk. He eventually moved to Melaka and built its empire. One event that proved the close relationship between Muar and Melaka was that in 1488, Sultan Alauddin Riayat Syah 1, died in Pagoh, Ulu Muar and was buried there.
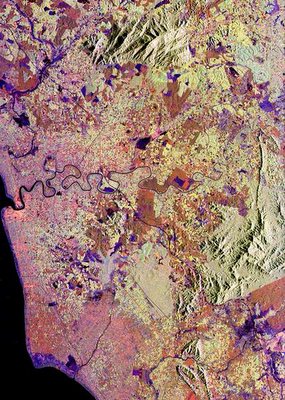
This spaceborne radar image shows patterns of agricultural development in Muar. The city of Muar is at the center of the left edge of the image at the mouth of the Muar River (Sungai Muar). The city is about 150 km (93 miles) southeast of Malaysia's capital Kuala Lumpur, and about the same distance northwest of Singapore. The coast at the left side of the image is on the Strait of Malacca, the narrow waterway separating Malaysia and the Indonesian island of Sumatra. Blue areas along the coast are tidal marshes. The fine patchwork patterns seen across the image in yellow and orange are groves of rubber, banana and oil palm trees, the dominant agricultural products of the region. Fields of other seasonal crops appear in darker shades of orange and purple. A sharp boundary is seen in the lower right between native forest in light green and clear-cut croplands in orange. This image was acquired by Spaceborne Imaging Radar-C/X-Band Synthetic Aperture Radar (SIR-C/X-SAR) onboard the space shuttle Endeavour on April 18, 1994. The image is 68.2 kilometers by 48.7 kilometers (42.3 miles by 30.2 miles) and is centered at 2.2 degrees North latitude, 102.7 degrees East longitude. North is toward the upper right. The colors are assigned to different radar frequencies and polarizations of the radar as follows: red is L-band, horizontally transmitted and received; green is L-band, horizontally transmitted, vertically received; and blue is C-band, horizontally transmitted, vertically received. This is another image for Muar, from IKONOS, 1m resolution,I got from CRISP...viva la a'Muar'ican!!!

Galileo, the first Europe’s global navigation satellite system
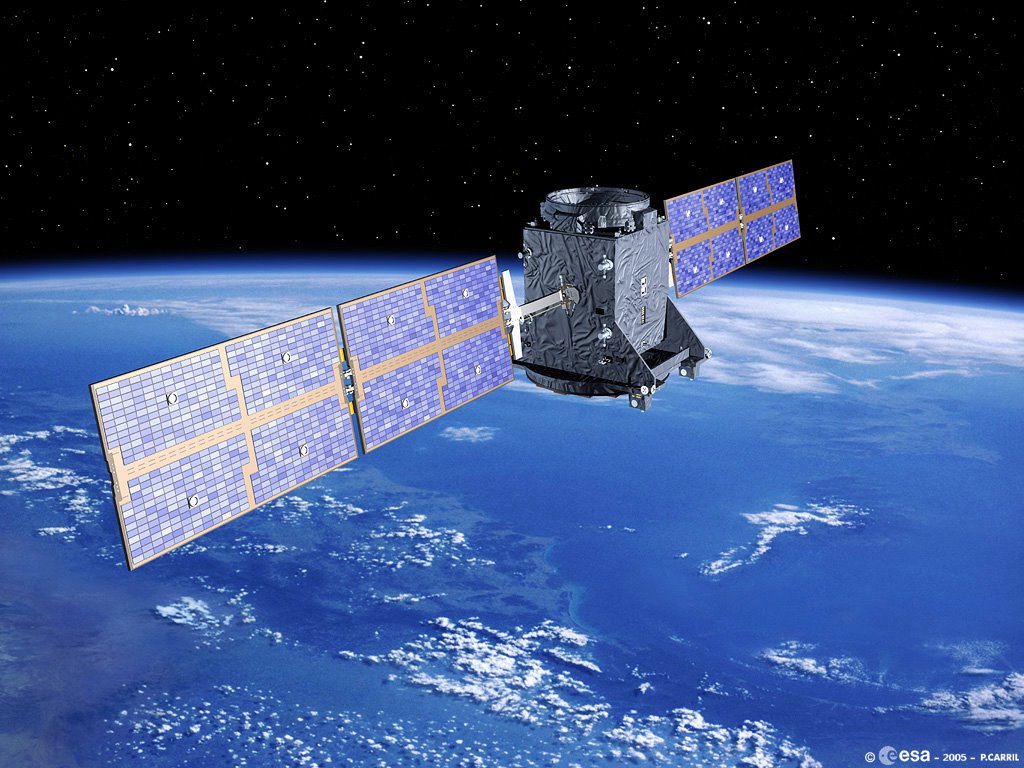
Galileo will be the first Europe’s own global navigation satellite system, providing a highly accurate, guaranteed global positioning service under civilian control. There are at present two radio navigation satellite networks in the world, one American (GPS), and one Russian (Glonass). Both were designed as military systems. Since the Russian system seems to have not succeeded in generating any significant civil applications, GALILEO offers a real alternative to the establishment of a de facto monopoly in favour of GPS and American industry.
It will be inter-operable with the Global Positioning System (GPS) and Russia’s Global Navigation Satellite System (Glonass), the two other global satellite navigation systems. Galileo will deliver real-time positioning accuracy down to the metric range with an unrivaled integrity. Numerous applications are planned for Galileo including positioning and derived value added services for transport by road, rail, air and sea, fisheries and agriculture, oil prospecting, civil protection activities, building, public works and telecommunications.
The operational Galileo system will consist of 30 satellites (27 operational + 3 active spares), deployed in circular Medium Earth Orbit (MEO) at an altitude of 23,616 km altitude, over three orbital planes inclined at 56 to the equatorial plane.To prepare for Galileo, Europe has implemented a preliminary satellite-based navigation system with the European overlay navigation system (EGNOS). This system delivers corrective and integrity data to enhance the performance of the two existing military navigation satellite constellations (GPS and Glonass). It has been operational since mid-2003.
Thursday, December 29, 2005
Highbury 1913-2006
 Highbury still for me is one of the best grounds in the Premiership.The stadium has a capacity of 38,500 (12,500 in the North Bank, 11,000 in the West Stand, 9,000 in the East Stand and 6,000 in the Clock End), all seated, and has two Jumbotron screens in the South-East and North-West corners. The stadium's main entrances are on Gillespie Road, Avenell Road and Highbury Hill.
 Highbury Stadium has been the home ground of Arsenal Football Club since 1913. It is located in Highbury, London giving rise to its popular name Highbury. The original Arsenal Stadium was built in 1913, when Woolwich Arsenal moved from their home in Plumstead, south-east London to Highbury, leasing the recreation fields of a local divinity college. Designed by renowned stadium architect Archibald Leitch, it featured a single stand on the eastern side, and the other three sides given banked terracing. However, no significant portion of Leitch's original stadium remains today, following a series of bold redevelopments during the 1930s.
The first of these was the West Stand, designed by Claude Waterlow Ferrier and William Binnie, with a distinctive Art Deco style, which opened in 1932; at the same time, the local Tube station was renamed from Gillespie Road to Arsenal. Leitch's main stand was demolished to make way for a new East Stand matching the west one in 1936, with its distinctive facade facing onto Avenell Road. The terraces at the north and south ends were both given roofs, and the southern terrace had a clock fitted to its front, giving it the name Clock End.
The stadium stayed more or less the same for the next fifty years, although during World War II the North Bank terrace was bombed and had to be rebuilt. Floodlights were fitted in 1951 (having been advocated by Arsenal manager Herbert Chapman some twenty years earlier). However, in the early 1990s, the Taylor report on the Hillsborough disaster was published, which recommended that football stadiums become all-seater. The North Bank, which had become home of Arsenal's most passionate supporters, was demolished in 1992, and a new all-seater stand constructed in its place. The Clock End was retained but redeveloped, and had seating and executive boxes fitted.
As well as being home to Arsenal, in the past Highbury has occasionally functioned as a home stadium for England matches; in all 12 internationals were played at Highbury from 1920 to 1961, most of them being friendlies. These included the "Battle of Highbury", England's famous 1934 3-2 win over World Champions Italy, where seven Arsenal players started the match. Highbury has also been the venue for 12 FA Cup semi-finals as a neutral ground, the first in 1929 and the most recent in 1997. Highbury has also seen several cricket and baseball matches, and was the venue for the 1966 World Heavyweight boxing title bout between Henry Cooper and Muhammad Ali (which Ali won).
The 2005-06 season will be Arsenal's last at Highbury. Arsenal will leave the Highbury Stadium when the new Emirates Stadium in nearby Ashburton Grove is opened, currently scheduled for summer 2006. Arsenal Stadium will then be redeveloped for housing; however, the exteriors of the East Stand, which is a Grade II listed building, and the matching West Stand, will be preserved. In June 2005 Arsenal received planning consent for a revised scheme which will see 750 properties built on the site. Here's the memorial Highbury from aerial photo...

Wednesday, December 28, 2005
Geography keep Philippines free of bird flu
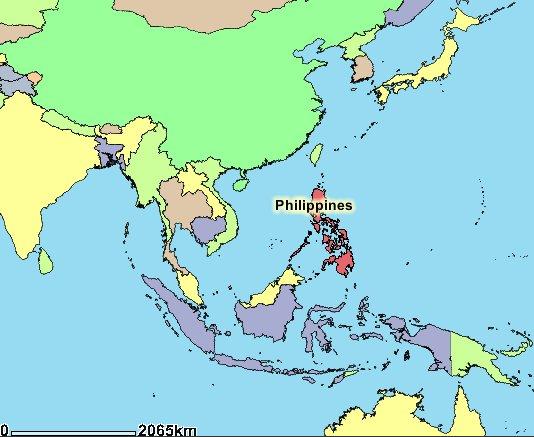
In October, Health Secretary Francisco Duque warned that it was "only a matter of time" before bird flu reached the Philippines. But thanks partly to geography to keep domestic poultry away from migratory birds, the country has so far remained free of the virus that has killed 71 people in Asia and ravaged chicken and duck farms. Dr. Jean-Marc Olive, the World Health Organisation (WHO) representative in the Philippines, said lower numbers of chickens on local farms compared with those in China, Thailand and Vietnam reduced the risk of infection.
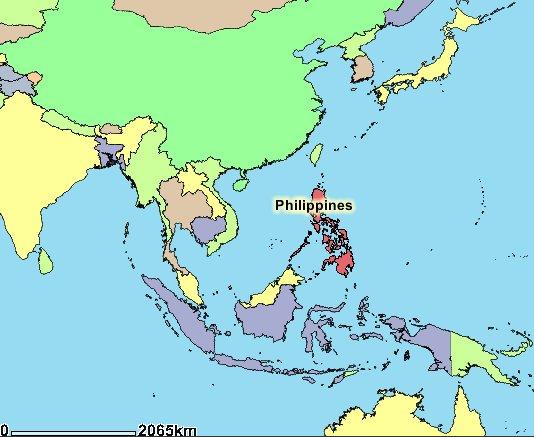
"I think it's mainly because of the geography," Olive said, adding the isolation of the Philippines, composed of 7,100 islands in the western Pacific Ocean, had enabled it to escape the virus that continues to spread in other areas in Asia. "What I understand from the situation here is that only ducks fly to the Philippines," he added. "There are no swans or geese flying over the Philippines ... unlike in Russia or Europe." Health experts have identified ducks, geese and swans as the main carriers of avian influenza among migratory birds. Despite its luck to date, the Philippines will have to stay vigilant now that the virus has spread to Indonesia, its southern neighbour across the Sulawesi Sea.
Tuesday, December 27, 2005
My house from space
Want to know more about a specific location? Dive right in -- Google Earth combines satellite imagery, maps and the power of Google Search to put the world's geographic information at your fingertips.
Google has folded Keyholes technology into their great mapping engine. I was pretty impressed by Google Earth, you know why? here's my house from space !!
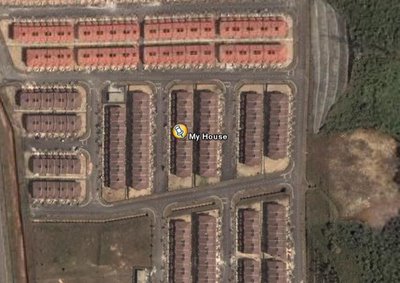
Google has folded Keyholes technology into their great mapping engine. I was pretty impressed by Google Earth, you know why? here's my house from space !!
Subscribe to:
Posts (Atom)